Capacity
While the main priority of ECFs is to maintain a proper level of security, facilities should also maximize traffic flow. Congestion at ECFs causes delay for personnel and creates a safety hazard. According to the UFC, ECFs must be capable of processing traffic demands with little or no delay under FPCON Bravo+.
Lane Processing Requirements
To accurately size an ECF, a lane-processing rate must be assumed. TEA has performed over 200 ECF security, safety, and capacity traffic engineering assessments. During these assessments, TEA has collected significant data, which has been used to establish new criteria regarding capacity and processing rates at ECFs. The manual processing rate per lane with one ID checker ranges from 800 to 1,200 vehicles per hour for FPCON Alpha. For FPCON Bravo, Bravo+, and Charlie this rate drops to a range of 300 to 450 vehicles per hour per lane. See table below for a summary of processing rates.
Exhibit 2.6 ECF Processing Rates
| Processing Technique |
Manual Checks1 |
Checks Using Handheld Devices2 |
Automated Lanes3 |
| Single Checks Per Lane |
Tandem Checks Per Lane |
Single Checks Per Lane |
Tandem Checks Per lane |
Without Traffic Arms |
With Traffic Arms
(Up/Down For Each Vehicle) |
| vphpl |
vphpl |
vphpl |
vphpl |
vphpl |
vphpl |
| No Identification4 |
Capacity at Roadway |
N/A |
N/A |
N/A |
N/A |
N/A |
| Vehicle identification only |
800 to 1,200 |
NA |
NA |
NA |
800 to 1,200 |
550 to 800 |
| Vehicle and occupant identification5 |
300 to 450 |
400 to 600 |
275 to 375 |
350 to 475 |
400 to 450 |
325 to 350 |
| Inspection of mission essential vehicles only |
20 to 120 |
NA |
20 to 120 |
NA |
NA |
NA |
Notes: vphpl = vehicles per hour per lane; NA - not applicable. Actual rates may exceed those shown (based on SDDCTEA experience).
(1) - Manual processing rates based on a compilation of SDDCTEA rates for over 200 ECF studies in the mid-2000s.
(2) - Handheld processing rates based on the Assessment of Automated Processing using Handheld Devices, December 2006; and data collected at Fort Leavenworth.
(3) - Automated lane processing rates are based on the Assessment of Phantom Express at Fort Hood, February 2008; and the US Army Evaluation Center, Assessment of Phantom Express, March 2006. Assumes “trusted traveler” type program; therefore, ID of all occupants is not required.
(4) - No identification is typically not utilized for installation access, special events only.
(5) - In reality, the average vehicle occupancy at ECFs, particularly in the morning peak period, is very close to 1.0. If multiple occupant vehicles are common with ID checks of all occupants, assume the lower range of processing rates.
Tandem Processing
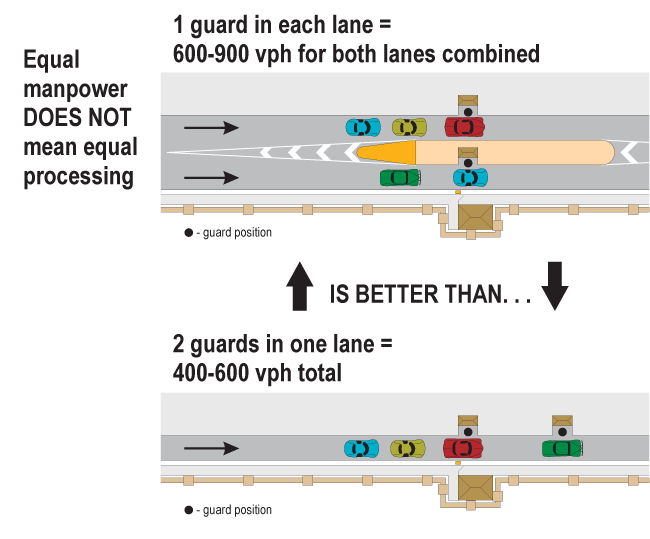
The UFC on ECFs states that all ECFs must be designed to accommodate tandem processing. To reduce congestion at ECFs, many installations use tandem processing, or additional guards per lane. TEA has found that having more than three ID checkers per lane provides little benefit. However, when at least two lanes are available, studies show that two guards, one in each lane, is more efficient than two guards in one lane.
| ID Checkers per Lane |
Vehicle Processing Rate per Lane |
| 1 |
300-450 |
| 2 |
400-600 |
| 3 |
450-675 |
| 4 |
475-700 |

Lane Requirements Based on Processing
The number of lanes planned for an ECF shall be sufficient to handle the expected volume of traffic (with an acceptable length of vehicle queuing) during times of peak demand (such as the morning peak hour). When evaluating the lane requirements for the ECF, a comparison should be drawn with all of the other ECFs at the installation to determine if the ECF in question will continue to serve the installation adequately in the future. If future land uses will change the population center that the ECF is to serve, that should be considered in the design of the ECF.
The incremental threshold for increasing the number of lanes at an ECF, under FPCON Bravo+, is 350 vehicles per hour (from 300 – 450 range on the lane processing chart above), which represents the processing rate of one ID checker performing manual ID checks. It is assumed that manpower will be minimized under FPCON Bravo+ conditions and therefore staffing will dictate one ID checker per lane. As the FPCON is elevated, additional manpower can be added to the tandem lanes, which will increase lane processing rates.
Even if ECFs are designed based on the lane capacities illustrated, some congestion may still occur due to the random arrival of vehicles and distinct peaking that typically occurs for short periods during the peak hour. Utilize the SDDCTEA SMART Decision Evaluator software to assist in performing lane calculations.
Sizing Visitor’s Center Parking

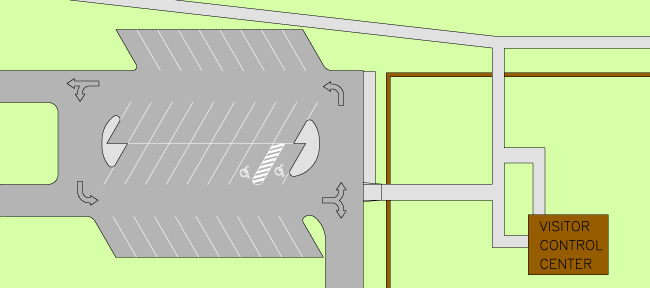
Most installations usually have one ECF that is the primary entrance for visitors. The UFC states that the visitor’s center should be able to process twelve to twenty visitors per hour per processor. This equals three to five minutes per visitor. In reality, the amount of parking needed at a visitor’s center depends on three things:
- The amount of visitor traffic during the peak hour of visitor activity
- The amount of staffing at the visitor’s center
- Duration for visitors to be processed (dependent on staffing and operating procedures)
In some cases, processing times may be as much as 10 to 15 minutes per person depending on functions performed and demand. The visitor center parking area should be sized to accommodate the maximum visitor center demand considering the processing times, plus staff requirements. As with any parking area, ADA requirements must be met.
Sizing Inspection Areas

Removing inspection procedures from the approach roadway is critical in maintaining efficient ECF operations. Sizing of inspection areas is similar to sizing visitor’s center parking areas and is dependent on the number of vehicles to be inspected as well as the amount of time it takes to inspect a vehicle. Ultimately, SF should be consulted in determining inspection area sizing, but these factors should be brought to their attention so that they can make an appropriate decision.
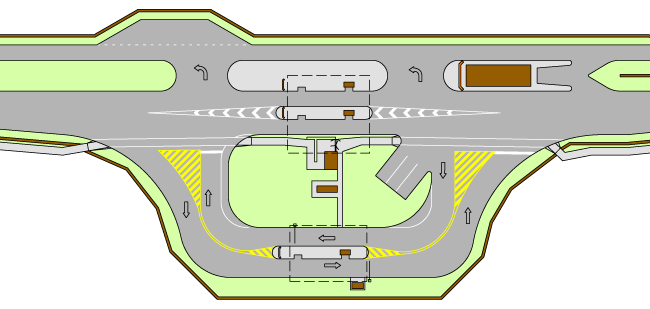
At a minimum, Primary and Secondary ECFs should provide space for inspection of three to five vehicles, which could be comprised of the roadway leading to the area. Bidirectional inspection areas located adjacent to the ID check lanes are advantageous because vehicles can be inspected without needing to travel through the ID check lanes, and they allow for inspections based on guard concern. At Low Volume and Limited Use ECFs, a turnout lane for vehicle rejections can be used if a pull-off area or parking spaces cannot be provided elsewhere.
Sizing Truck Holding Areas
In terms of processing, large trucks and their respective inspection activities are much different from those activities associated with other vehicle types. Some installations with high truck demands prefer a separate truck entrance, while others use dedicated truck processing facilities at vehicular ECFs.
Truck inspection areas should be sized to accommodate peak hour demands. Ideally, two weeks worth of truck arrival data should be reviewed to ensure that the true peak is captured. The calculations are similar to visitor and vehicle processing calculations, but must consider the longer processing times of trucks and also the larger vehicle size. In some cases, where there is significant truck volume over several hours, the cumulative demands should be considered. All hours of the day when trucks are being accepted should be reviewed to determine the actual design truck demand because the peak hour of truck demand can vary from the peak hour of vehicular demand at POV gates.
Processing times vary based on security procedures, but often range from three to five minutes per vehicle, which equates to twelve to twenty trucks per hour processed. Where multiple inspection lanes are present, these rates are doubled. Once the number of vehicles not processed is known, that number represents the size of holding area needed.


